
Claude Code Hit Escape Velocity in January. So I Used Claude Code to /Catch-Up.
A few charts to confirm what we all already feel, and a slash command to help you keep up.


Last week I opened Claude Code for the first time in about thirty days and felt like I was looking at a different product.
There were commands I didn’t recognize. Features people were tweeting about that I had zero context on. I use this tool every single day when I’m building, I write about it on this Substack, and I run a software agency where most of my engineers live inside of it. After my first few weeks away from Claude Code’s changelog, I felt behind.
I had spent nearly all of March buried in a fintech client project, getting over a year of code and infrastructure through a SOC2 audit. For anyone who hasn’t lived through one of those, it is the specific kind of work that consumes your attention completely. No time for X, podcasts, or side projects. Just control documentation, evidence collection, and the slow grind of making sure every system has a paper trail.
When I came up for air at the start of April and opened the Claude Code changelog, I just stared at it.
Two camps
There are two camps of people on this question right now, and I think it’s worth naming both before I show you anything.
The first camp is what I’ll call the “calm down” camp. Their position is reasonable. You don’t need to use every feature. You don’t need to know what shipped yesterday. Pick a workflow that works for you and go. Claude Code is still Claude Code. The thing you were using last month still works.
The second camp, and I am firmly in it, thinks the first camp is underestimating what’s actually happening.
I wanted to prove the second camp is right, so I did what I usually do when I’m confused about something. I went to the source.
Pulling the data
I cloned the anthropics/claude-code GitHub repository and pulled every tagged release from the last year. I extracted CHANGELOG.md at HEAD, parsed every version header, and ran git blame on the changelog file to date every entry back to the commit it was first written. That gave me 258 dated releases spanning April 2, 2025 to April 9, 2026.
I wanted to look at this four different ways, because I thought I owed it to the “calm down” camp to be fair. Every version of the chart I built was a response to an objection I could imagine them making. Here’s the progression.
Chart 1: Just count the releases
The first version of the chart is the one most people arrive at if they bother to check at all. You count tagged releases. One per version. Plot them by day.
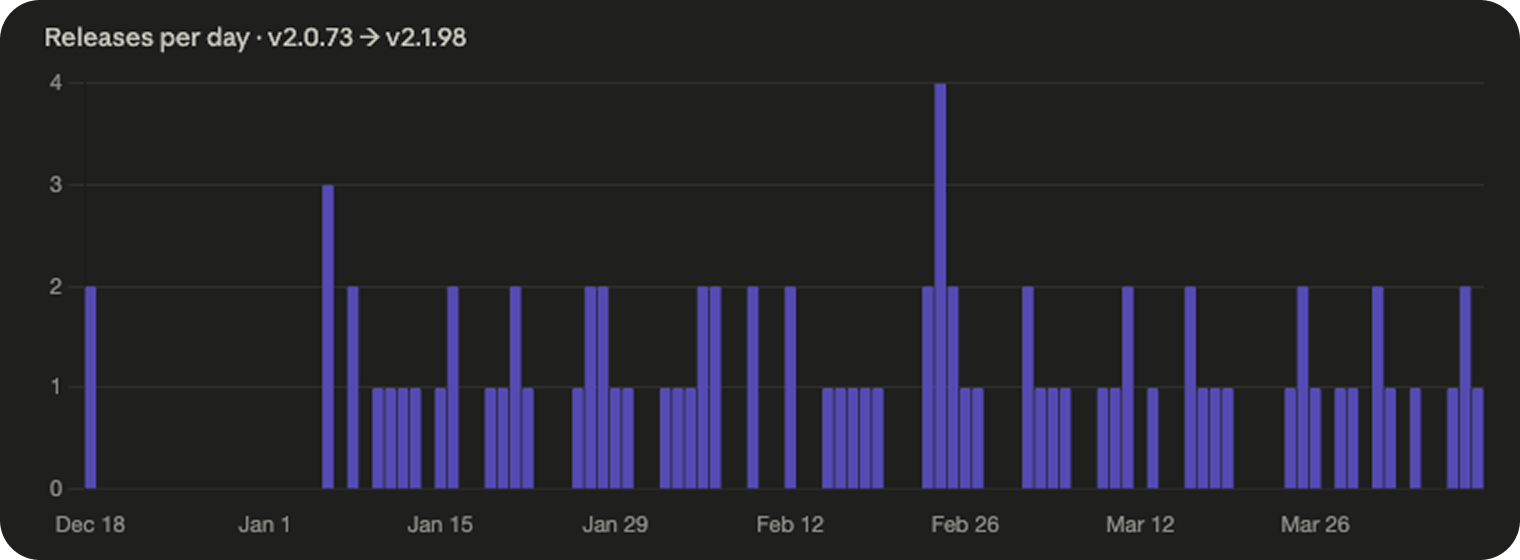
258 releases in a year. Over the last four months, that’s roughly one release every 24 hours of business time. One per working day, stretched across a year, for a single product.
Those numbers sound damning on their own, but they’re not honest. A release that fixes one typo counts the same as a release that adds a major new feature. Counting releases is like counting commits.
Chart 2: Count the changelog bullets
Every Claude Code release ships with a changelog, and each release has a variable number of bullets describing what changed. So instead of counting releases, I counted the bullets inside them.
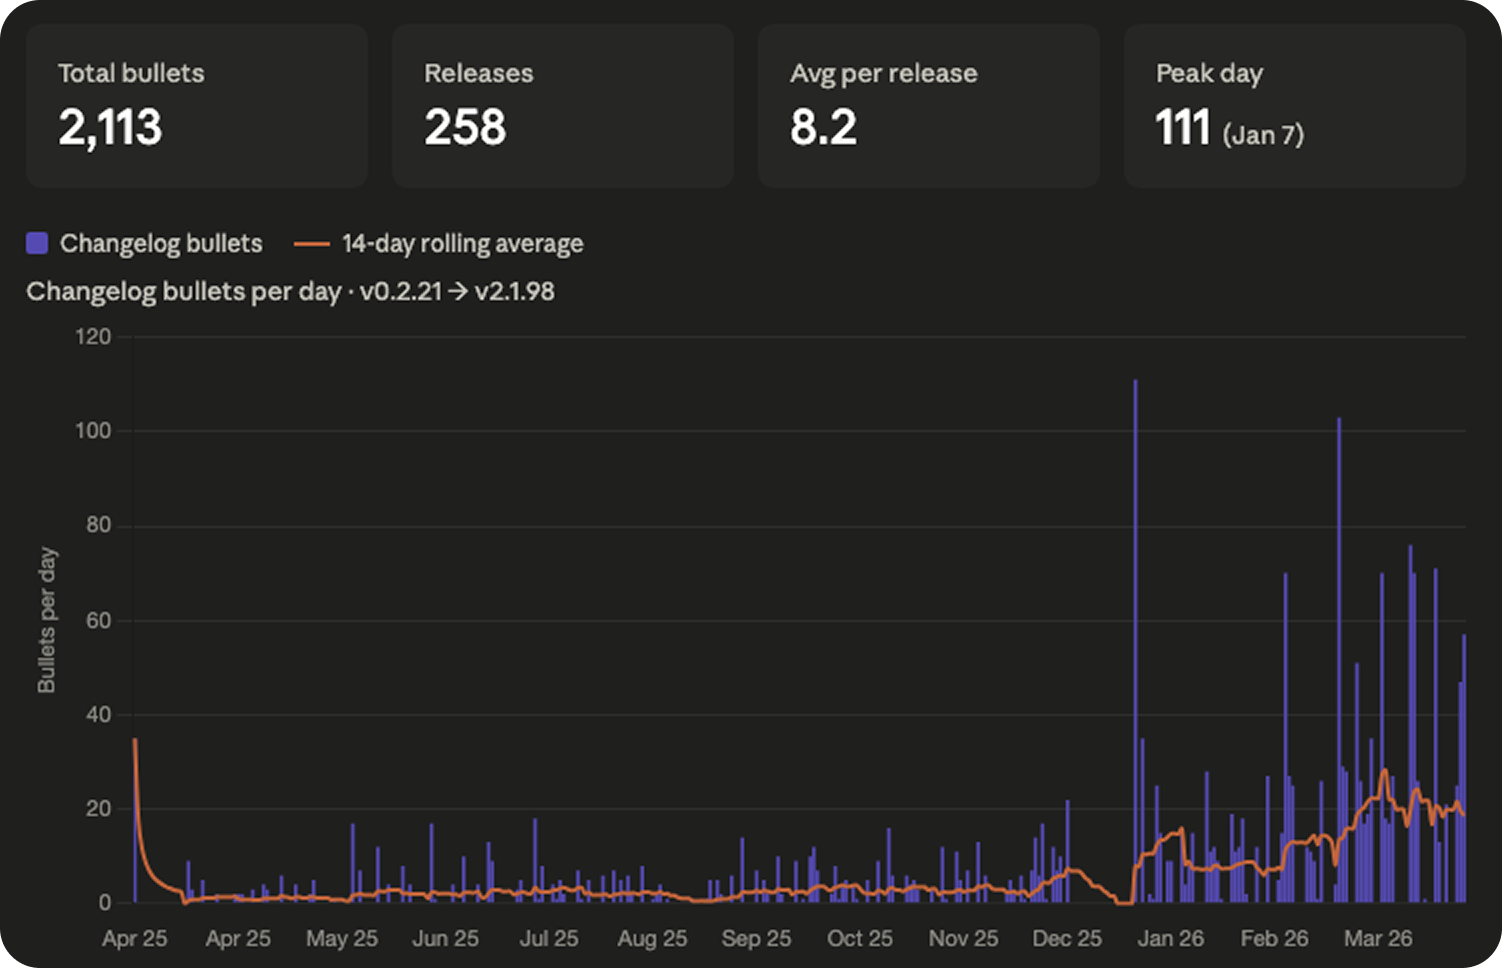
2,113 changelog bullets across 258 releases. About eight per release on average. One “update” from Anthropic is rarely one change. It’s usually eight things, stacked.
This is the first chart where you can start to see the shape I ended up obsessing over. For the first eight months, it’s mostly quiet. Then something happens around the new year.
I’ll come back to that.
But this chart has the same fundamental problem in a new form. “Fixed a typo in an error message” is still counted the same as “Added Channels: full Telegram and Discord integration with bidirectional MCP bridge.” Those are not the same kind of change.
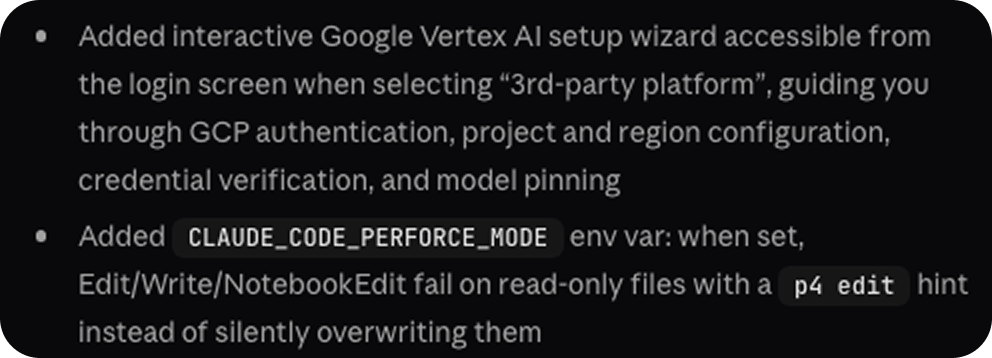
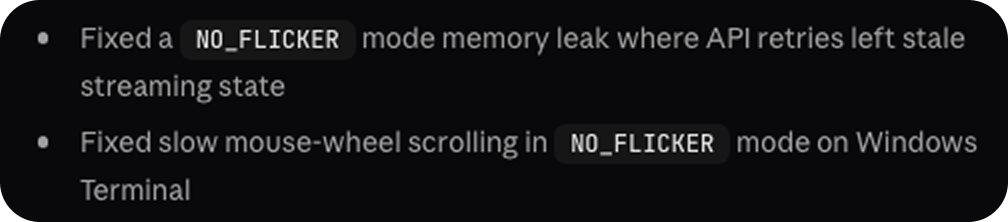
You can see what I mean in the screenshot above. A short bullet and a long bullet, side by side. The character count alone carries meaningful signal about how much actually landed.
Chart 3: Weight by category
I categorized every bullet as one of four things: Added, Improved, Fixed, or Other. Then I weighted them.
Added features got a weight of four. Improved and Changed items got a weight of two. Fixed and Other items got a weight of one. Multiplied, stacked, colored.
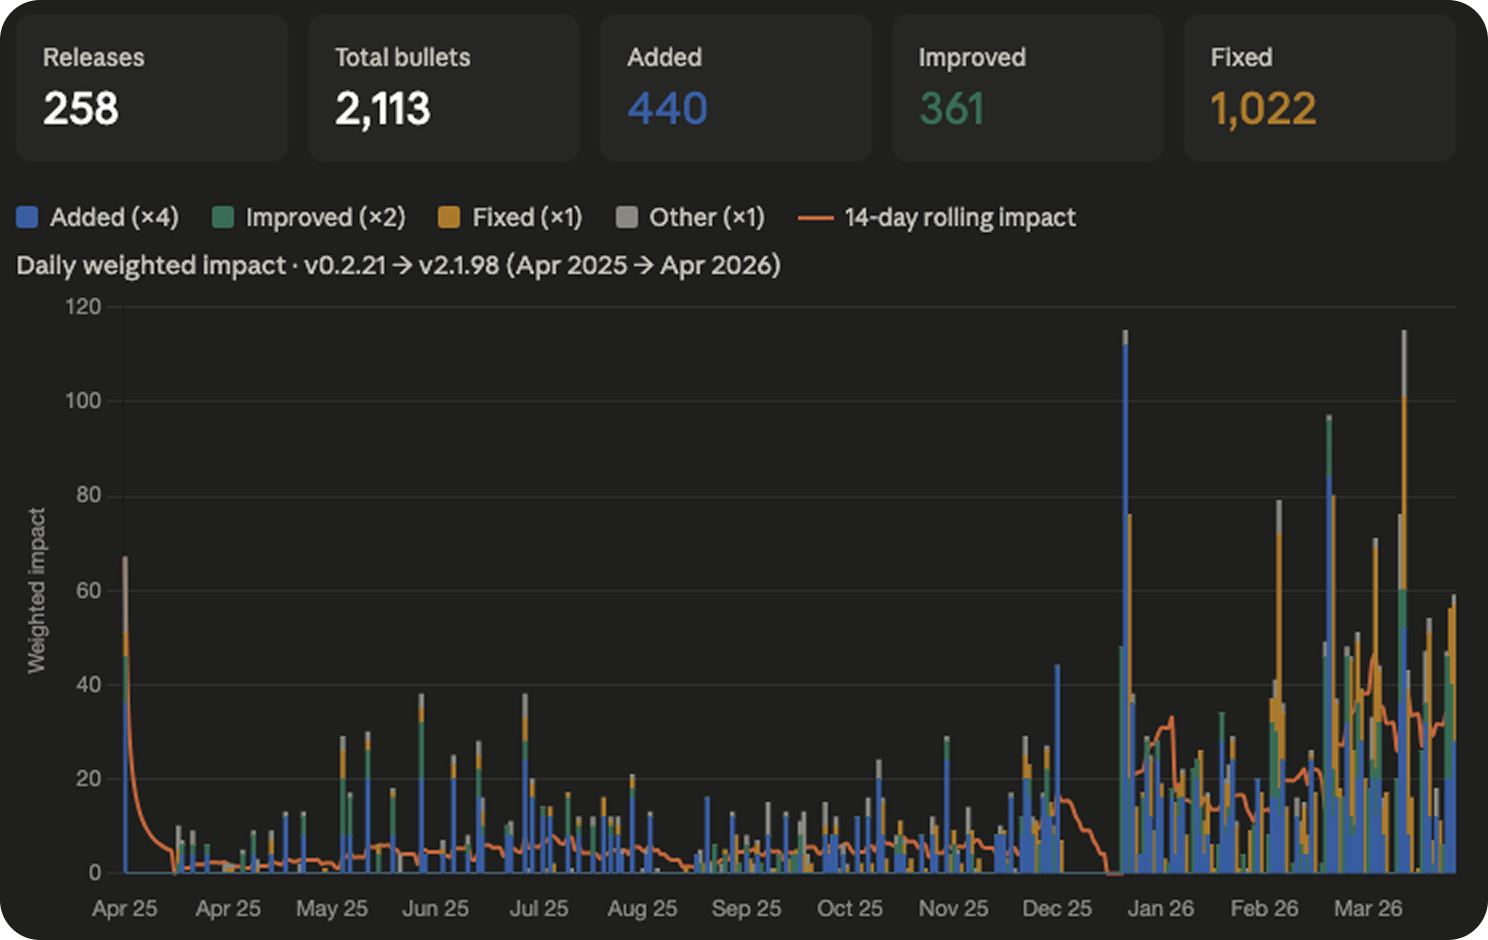
Now you can see the shape of what’s shipping, not just the volume. And the first thing you notice is the orange.
The orange band is bug fixes. There’s a lot of orange. Across the full year, Anthropic shipped roughly 2.3 bug fixes for every new feature. A meaningful portion of the velocity you’re seeing is them patching things they shipped the week before. It’s how shipping fast actually works, especially when the product is being used by millions of developers in configurations nobody at Anthropic can fully predict.
But this chart is still wrong in a subtle way. Every Added bullet counts the same as every other Added bullet. Channels, the feature that briefly made people think Anthropic was going to kill the third-party agent ecosystem, counts as one Added times four. So does “Added a new environment variable for cache configuration.” Same score. Obviously not the same thing.
Chart 4: Weight by length
I weighted every single bullet by its character length. The intuition is straightforward. When Anthropic ships something big, they write a long description for it. When they ship something small, they write a short one. The mega-features get longer ones. It’s not perfect, but it’s worth acknowledging.
I multiplied character length by category weight, summed everything up per day, and plotted the full year. Then I went one step further and annotated the chart with the actual named launches that people talk about. Hooks. Skills. Subagents. Plugins. Worktrees. 1M context. Channels. Auto mode. The big things.
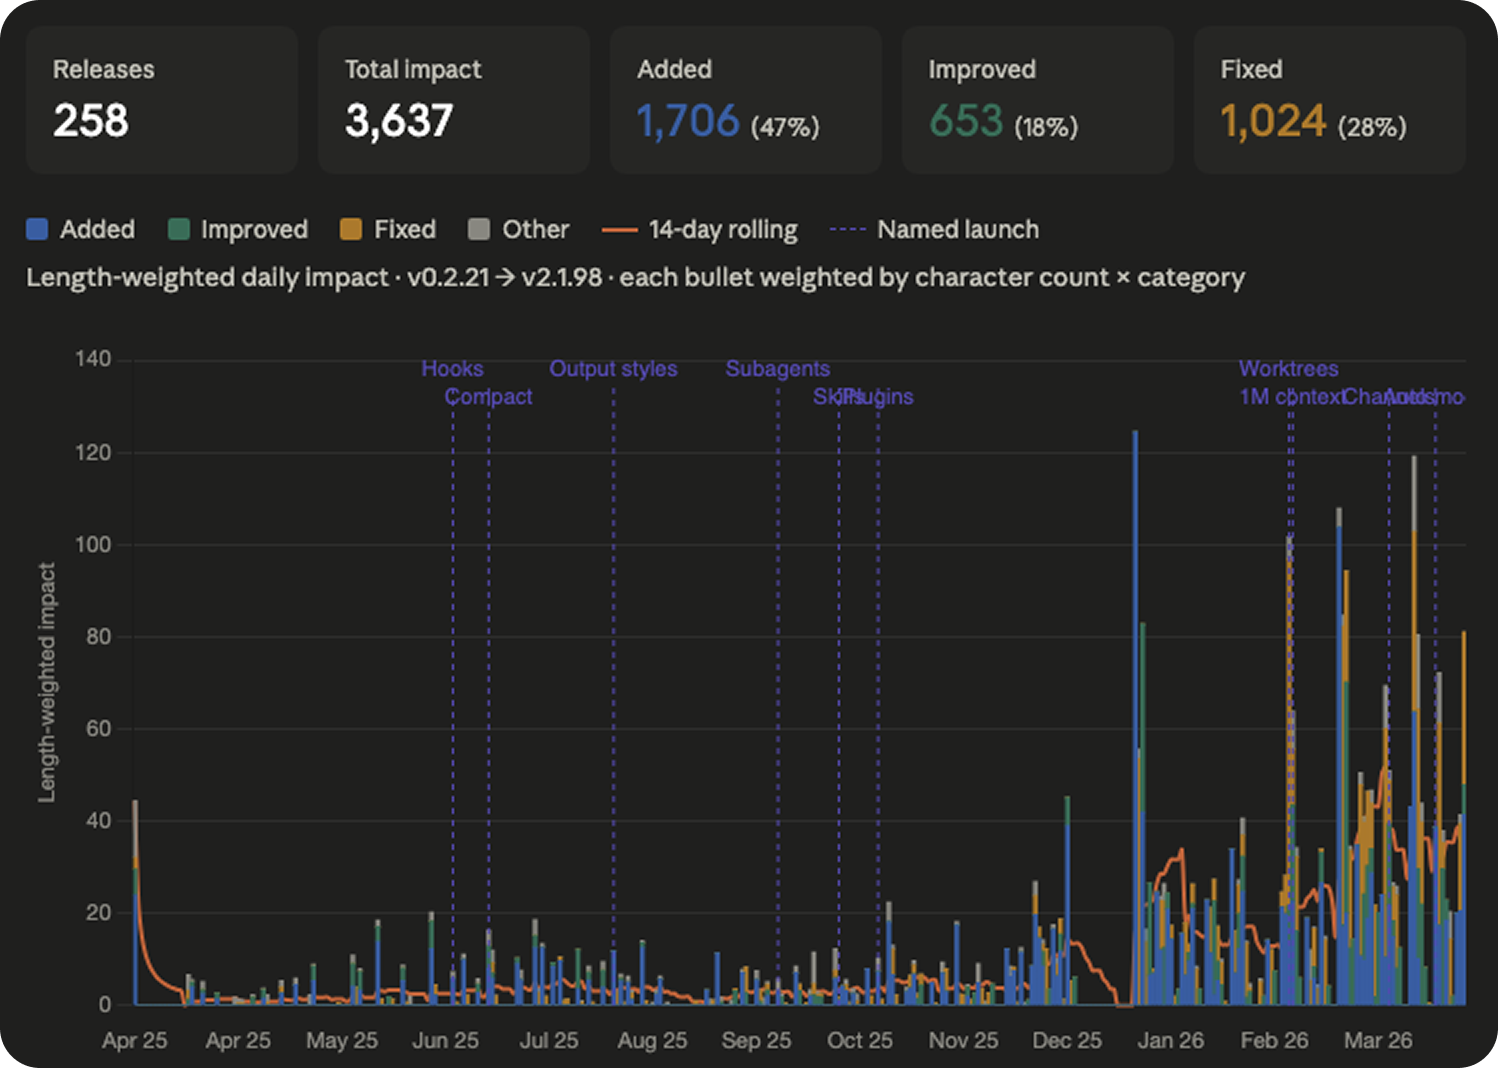
Look at the line on the bottom for the first eight months. It hovers somewhere between two and six. Flat. Steady. A product being developed at a rhythm we can absorb.
Then January 7th happens. v2.1.0 drops. And the floor of the chart doubles and never comes back down.
That is escape velocity. Anthropic broke orbit on January 7th and the new altitude is just the altitude now.
I want to be careful not to overstate this, because the first eight months aren’t nothing. Hooks shipped in June. Subagents in September. Skills in October. These are really useful and impressive features that people built real workflows around. But the rate at which they were arriving was something a normal human with a normal job could track. The new rate is not.
The maximum rate of absorption
When I finished building the charts, I sat with them for a few hours and got to a thought that kind of messed me up for a night.
We are at a ceiling. A ceiling that I don’t think most people in the industry are willing to accept. It is the ceiling of what a working human, with a job and other responsibilities and some expectation of sleep, can actually absorb in a given week.
Call it the maximum rate of absorption.
There was a window, roughly from when Claude Code launched through the end of last year, where a reasonably attentive developer could track everything Anthropic was shipping. You could read the changelog on Monday morning, try the new features that mattered to your work, and be more or less caught up by Monday afternoon. The product was evolving fast, but it was evolving at a human tempo. The tempo mattered.
That window closed sometime in January.
Past that point, the amount of surface area Anthropic is shipping per unit time exceeds what a single human can meaningfully evaluate, learn, and adopt. Simon Willison, who built his reputation on tracking exactly this kind of thing, told Business Insider recently that he hasn’t taken a proper break in three years and that he is “mass-subscribing to feeds” just trying to keep up. If Simon is drowning, you are drowning. Everyone who claims otherwise is drowning. The only difference is whether they'll admit it.
And the part that I whole heartedly believe: I don’t think Anthropic is building for humans anymore.
I don’t mean that as a conspiracy or a criticism. I mean it as a simple observation about their velocity. The tooling is getting richer faster than we can learn it. The configuration surface is getting denser faster than we can read the docs. The integration points are multiplying faster than we can wire them up. The only entity in the world that can actually keep pace with a product shipping at this rate is another AI.
We got our oracle moment. We built a tool that can absorb all the other tools. And now the tool that can absorb all the other tools is getting built, at some level, for the tool that absorbs all the other tools. Humans are still in the loop, but at what point will we start to look more like beta testers than users. We’re the training signal, not the target.
I wrote a piece a couple of months ago called The Great Filter for Ideas, where I argued that the people who were going to build with AI were mostly the ones who were already building before AI. The unlock came, but it came for the people who were going to build anyway. This feels like an extension of the same story from a different angle. The tooling is sprinting ahead of human comprehension. The gap is widening. And the only way to close it, if you are a working developer with a job and a family and some interest in staying sane, is to outsource the tracking of the tool to the tool itself.
Which is what brings me to the thing I actually built.
The slash command
I built a skill called /catch-up. When you run it in Claude Code, it kicks off a multi-minute audit of your entire setup and produces a long, opinionated, evidence-backed report.
Under the hood it spawns three research agents in parallel. One fetches the full Claude Code feature surface from the official docs and the changelog — every slash command, every hook event, every CLI flag, every settings option. One does a deep dive on your actual usage history: it reads your past 25 sessions from ~/.claude/projects/, counts which tools you actually call, which slash commands you actually type, which prompts you keep repeating, and which errors keep showing up. The third audits your configuration top to bottom, global and project CLAUDE.md, every skill in ~/.claude/skills/, every MCP server, every hook, every custom agent, plus the shape of the repo itself.
Then it cross-references all three and writes you a report with eight sections.
The first section is a profile dashboard. Sessions analyzed, tool call breakdown, error count, branches you’ve worked on, what’s installed. The second is a feature adoption matrix, every meaningful Claude Code capability with your status next to it. Using, Configured but never called, Not set up, Remove this. The third is recent launches with a does this apply to you verdict on each one. The fourth is dead weight, MCP servers you configured but never call, plugins that load on every session and never fire, hooks running on the wrong events. The fifth is workflow automation. The skill mines your repeated prompts and surfaces patterns. You typed “run the tests” eleven times last week. Here’s a slash command that does it. The sixth is CLAUDE.md gaps. The seventh is configuration improvements. The eighth is a prioritized action list with time estimates next to each item, ranked by impact.
And every single recommendation is cited. You have zero Swift files in this project but the swift-lsp plugin loads on every session. Here is the command to disable it. You asked “what branch am I on” in three different sessions this week. Here is a status line config that puts the branch in your prompt. You have a Figma file in /design and you have never installed the Figma MCP. Here is the install command. It does not give you generic advice. It tells you specifically what it saw and what to do about it.
The best part is that the report is interactive. At the end it says: “Reply with the numbers of items you want me to execute now.” You type back which ones you want, and Claude Code installs the missing MCP server, adds the hook, rewrites the skill frontmatter, trims your CLAUDE.md, updates your settings, all in the same session. You stay in your chair and the gap closes while you watch.
How to install
Copy the skill code below.
Create the skills directory if it doesn’t exist yet. Open your terminal and run:
mkdir -p ~/.claude/skills/catch-upCreate the skill file at the right path. Still in your terminal:
nano ~/.claude/skills/catch-up/SKILL.md(Or use any text editor — vim, code, cursor, whatever you prefer.)
Paste the contents you copied in step 1 into the file. Save and close.
In
nano:Ctrl+O,Enter,Ctrl+XIn
vim::wqIn a GUI editor:
Cmd+S
Verify the file is in the right place:
ls ~/.claude/skills/catch-up/You should see SKILL.md listed.
Open a new Claude Code session in any project. If you have a session open already, exit it first (
Ctrl+Dor/exit) and start a new one withclaudefrom the project directory you want to audit. Skills are loaded at session start, so an existing session won’t see the new skill until you restart.Run the command:
/catch-up⚠️ Heads up: the report is long on purpose. The skill runs at effort:high with ultrathink enabled, takes anywhere from 2 to 20 minutes, and uses a good amount of tokens. Make sure you've got the time and the budget before you run it.
---
name: catch-up
description: Full Claude Code capability audit — enumerates every feature available, maps each against your actual usage and config, surfaces what you're missing, highlights recent launches, and produces an exhaustive personalized report. User-invoked only — the agent will never auto-fire this.
allowed-tools: Read, Glob, Grep, Bash, WebFetch, Agent
disable-model-invocation: true
effort: high
---

# Catch Up

ultrathink

You are running a comprehensive Claude Code audit. The goal is to help the user discover and use every Claude Code feature relevant to how they actually work — not just recent additions, but the full capability surface. A user who types /catch-up wants a thorough report, not a quick summary. Be exhaustive. Be specific. Be verbose. This report should take several minutes to produce and should be long.

The output has two parts:
1. **The full picture** — here is everything Claude Code can do, organized by category, with your current adoption status next to each
2. **Personalized action items** — here is what you specifically should do, backed by evidence from your actual sessions, config, and codebase

---

## ANTI-HALLUCINATION RULE

Every feature citation must quote exact text from a source you fetched. Never invent version numbers, dates, or feature descriptions. If you cannot find a real source for a claim, write: `[no source found — inferred from analysis]`. This rule applies to every single item in your output.

---

## Step 1 — Locate session directory

Run this first. You need the actual path before spawning agents.

```bash
CWD=$(pwd)
PROJECT_KEY=$(echo "$CWD" | sed 's|/|-|g; s|_|-|g')
SESSIONS_DIR="$HOME/.claude/projects/$PROJECT_KEY"

if [ -d "$SESSIONS_DIR" ] && [ -f "$SESSIONS_DIR/sessions-index.json" ]; then
  echo "FOUND:$SESSIONS_DIR"
else
  BASENAME=$(basename "$CWD" | sed 's|_|-|g')
  CANDIDATE=$(ls "$HOME/.claude/projects/" 2>/dev/null | grep -- "-$BASENAME$" | head -1)
  if [ -n "$CANDIDATE" ]; then
    echo "FOUND:$HOME/.claude/projects/$CANDIDATE"
  else
    echo "NOT_FOUND"
  fi
fi
```

Also run:
```bash
pwd
cat package.json 2>/dev/null | python3 -c "import json,sys; p=json.load(sys.stdin); print(p.get('name','?'), '|', p.get('version','?'))" 2>/dev/null
```

Record the actual SESSIONS_DIR path and project name. You will embed these in the agent prompts below.

---

## Step 2 — Launch three research agents in parallel

**Critical**: spawn all three agents in a single message so they run simultaneously. Do not wait for one before starting the next.

Embed the actual SESSIONS_DIR path and project cwd into each agent prompt before launching.

---

### Agent A — Full Feature Researcher

Prompt (fill in PROJECT_CWD with the actual path before sending):

```
You are researching the complete Claude Code feature set to build an exhaustive inventory.

Fetch ALL of these pages. Do not skip any. Read each one fully:

1. https://code.claude.com/docs/en/changelog
2. https://code.claude.com/docs/en/
3. https://code.claude.com/docs/en/settings
4. https://code.claude.com/docs/en/hooks
5. https://code.claude.com/docs/en/mcp
6. https://code.claude.com/docs/en/skills
7. https://code.claude.com/docs/en/memory
8. https://code.claude.com/docs/en/cli-reference
9. https://code.claude.com/docs/en/tools-reference
10. https://api.github.com/repos/anthropics/claude-code/releases?per_page=50

From these sources, build a COMPLETE feature inventory organized into these categories. For each item, include: feature name, what it does (1 sentence), how to enable it, and the source URL + quote.

CATEGORIES TO COVER (be exhaustive within each):

**A. Built-in slash commands**
List every /command that exists. Include what it does and any arguments.

**B. Hook events**
List every hook event type (PreToolUse, PostToolUse, PostToolUseFailure, UserPromptSubmit, Stop, SubagentStop, PostCompact, TaskCreated, WorktreeCreate, WorktreeRemove, CwdChanged, FileChanged, StopFailure, SessionStart, SessionEnd, InstructionsLoaded, ConfigChange, ElicitationResult, PermissionDenied, etc.)
For each: what triggers it, what data it receives, what it can return.

**C. MCP capabilities**
What MCP servers can do, how to configure them, OAuth support, etc.

**D. Skill system**
All frontmatter fields available in SKILL.md (name, description, allowed-tools, disable-model-invocation, effort, model, argument-hint, etc.)
What skills can do that plain commands can't.

**E. Agent/subagent system**
Custom agents in .claude/agents/, frontmatter fields, background agents, worktree isolation, the Agent tool, SendMessage, etc.

**F. CLI flags and modes**
Every flag: --resume, --continue, --worktree, --bare, --print, --model, --effort, --agent, --channels, --name, --mcp-config, etc.
Special modes: auto mode, bypass-permissions, accept-edits, plan mode.

**G. Settings and configuration**
Every setting in settings.json that is useful for a typical developer. Group: permissions, hooks, MCP, display, performance, experimental.

**H. Keyboard shortcuts**
All default shortcuts and any that are rebindable via keybindings.json.

**I. Recent launches (last 60 days)**
List every significant feature released in the last 60 days in chronological order newest-first. Include: feature name, release version, date, what it does, how to enable.

**J. Status line**
What statusLine supports, the JSON schema, refreshInterval, rate_limits field, etc.

**K. Memory system**
Auto-memory, /memory command, MEMORY.md, custom memory directory, etc.

Return the COMPLETE inventory. Do not summarize or truncate. Include everything you found. Quote sources for everything.
```

---

### Agent B — Deep Usage Analyst

Prompt (fill in SESSIONS_DIR with the actual path before sending):

```
You are doing a deep analysis of Claude Code usage history for this project.

Sessions directory: SESSIONS_DIR_PLACEHOLDER

Run ALL of the following analyses. Be thorough. Return raw data and patterns, not just summaries.

**B1. Session overview**
```bash
python3 << 'PYEOF'
import json, os
path = "SESSIONS_DIR_PLACEHOLDER/sessions-index.json"
with open(path) as f:
    idx = json.load(f)
entries = sorted(idx.get("entries", []), key=lambda e: e.get("modified", ""), reverse=True)[:25]
print(f"Total sessions: {len(idx.get('entries', []))}")
print(f"Showing most recent 25:\n")
for e in entries:
    date = e.get("modified", "?")[:10]
    msgs = e.get("messageCount", "?")
    branch = e.get("gitBranch", "") or "—"
    summary = e.get("summary", "")[:100]
    first = e.get("firstPrompt", "")[:80]
    print(f"{date} | {str(msgs):>4}msg | {branch}")
    print(f"  {summary}")
    print(f"  → {first}")
    print()
PYEOF
```

**B2. Tool call frequency (all recent sessions)**
```bash
ls -t "SESSIONS_DIR_PLACEHOLDER"/*.jsonl 2>/dev/null | head -25 | xargs grep -hoE '"tool_name":"[A-Za-z_][A-Za-z0-9_]*"' 2>/dev/null | sed 's/"tool_name":"//;s/"//' | sort | uniq -c | sort -rn | head -40
```
Also try this pattern if the above returns nothing:
```bash
ls -t "SESSIONS_DIR_PLACEHOLDER"/*.jsonl 2>/dev/null | head -25 | xargs grep -hoE '"name":"[A-Za-z_][A-Za-z0-9_]*"' 2>/dev/null | sed 's/"name":"//;s/"//' | grep -v '^$' | sort | uniq -c | sort -rn | head -40
```

**B3. MCP tool usage**
```bash
ls -t "SESSIONS_DIR_PLACEHOLDER"/*.jsonl 2>/dev/null | head -25 | xargs grep -hoE '"name":"mcp__[^"]+' 2>/dev/null | sed 's/"name":"mcp__/mcp__/' | sort | uniq -c | sort -rn
```

**B4. Slash commands used**
```bash
ls -t "SESSIONS_DIR_PLACEHOLDER"/*.jsonl 2>/dev/null | head -25 | xargs grep -hoE '"text"\s*:\s*"/[a-z][a-z0-9_/-]*' 2>/dev/null | grep -oE '/[a-z][a-z0-9_/-]*' | sort | uniq -c | sort -rn | head -30
```

**B5. Repeated user prompts (pattern mining)**
```bash
ls -t "SESSIONS_DIR_PLACEHOLDER"/*.jsonl 2>/dev/null | head -25 | while IFS= read -r f; do
  python3 - "$f" << 'PYEOF'
import json, sys
try:
    for line in open(sys.argv[1], errors='replace'):
        try:
            obj = json.loads(line)
            if obj.get('type') != 'user':
                continue
            msg = obj.get('message', {})
            if not isinstance(msg, dict):
                continue
            content = msg.get('content', '')
            if isinstance(content, list):
                for block in content:
                    if isinstance(block, dict) and block.get('type') == 'text':
                        t = block.get('text', '').strip()
                        if 15 < len(t) < 150 and not t.startswith('<') and not t.startswith('{'):
                            print(t)
            elif isinstance(content, str):
                t = content.strip()
                if 15 < len(t) < 150 and not t.startswith('<') and not t.startswith('{'):
                    print(t)
        except:
            pass
except:
    pass
PYEOF
done 2>/dev/null | sort | uniq -c | sort -rn | head -40
```

**B6. Error patterns**
```bash
ls -t "SESSIONS_DIR_PLACEHOLDER"/*.jsonl 2>/dev/null | head -25 | xargs grep -ohoE '"is_error"\s*:\s*true' 2>/dev/null | wc -l
echo "---"
ls -t "SESSIONS_DIR_PLACEHOLDER"/*.jsonl 2>/dev/null | head -25 | xargs grep -hoE 'String to replace not found|permission denied|requires permission|not allowed|command not found|ENOENT|EACCES|WebGL|WebSocket.*failed|403|404|500' 2>/dev/null | sort | uniq -c | sort -rn | head -20
```

**B7. Session depth distribution**
```bash
python3 << 'PYEOF'
import json
with open("SESSIONS_DIR_PLACEHOLDER/sessions-index.json") as f:
    idx = json.load(f)
counts = sorted([e.get("messageCount", 0) for e in idx.get("entries", [])], reverse=True)
print(f"All sessions by depth: {counts[:30]}")
print(f"Average: {round(sum(counts)/len(counts),1) if counts else 0}")
print(f"Max: {max(counts) if counts else 0}")
over30 = len([c for c in counts if c > 30])
over60 = len([c for c in counts if c > 60])
print(f"Sessions > 30 msgs: {over30}")
print(f"Sessions > 60 msgs (autocompact risk): {over60}")
PYEOF
```

**B8. Git branch patterns from session history**
```bash
python3 << 'PYEOF'
import json
with open("SESSIONS_DIR_PLACEHOLDER/sessions-index.json") as f:
    idx = json.load(f)
branches = {}
for e in idx.get("entries", []):
    b = e.get("gitBranch", "") or "unknown"
    branches[b] = branches.get(b, 0) + 1
for b, count in sorted(branches.items(), key=lambda x: -x[1]):
    print(f"{count:>4}x {b}")
PYEOF
```

**B9. Recent session summaries (more detail)**
Read the summaries from sessions-index.json for the 10 most recent sessions in full. Show the complete summary field for each.

**B10. Tool use interrupts**
```bash
ls -t "SESSIONS_DIR_PLACEHOLDER"/*.jsonl 2>/dev/null | head -25 | xargs grep -hoE '"interrupted"\s*:\s*true|"cancelled"\s*:\s*true|user.*interrupt|tool.*cancel' 2>/dev/null | wc -l
```

Return ALL raw data. Do not truncate output. The caller needs the full picture to make recommendations.
```

---

### Agent C — Config and Project Auditor

Prompt (fill in PROJECT_CWD with the actual working directory before sending):

```
You are doing a complete audit of a project's Claude Code configuration and codebase structure.

Working directory: PROJECT_CWD_PLACEHOLDER

Read ALL of the following. Return the full content of each (not summaries).

**C1. Global Claude configuration**
- Read ~/.claude/CLAUDE.md — show line count and full content
- Read ~/.claude/settings.json — show full content
- Read ~/.claude/settings.local.json if it exists
- List ~/.claude/skills/ — show all skill names and their SKILL.md frontmatter
- List ~/.claude/commands/ — show all command names
- List ~/.claude/agents/ — show all agent names and their frontmatter

**C2. Project-level Claude configuration**
- Read PROJECT_CWD_PLACEHOLDER/CLAUDE.md — show full content and line count
- Read PROJECT_CWD_PLACEHOLDER/.claude/settings.json if it exists
- Read PROJECT_CWD_PLACEHOLDER/.claude/settings.local.json if it exists
- List PROJECT_CWD_PLACEHOLDER/.claude/skills/ — show all skill names
- List PROJECT_CWD_PLACEHOLDER/.claude/commands/ — show all command names
- List PROJECT_CWD_PLACEHOLDER/.claude/agents/ — show all agent names
- Read PROJECT_CWD_PLACEHOLDER/.mcp.json if it exists

**C3. Auto-memory files**
List and read ALL files in:
~/.claude/projects/$(echo "PROJECT_CWD_PLACEHOLDER" | sed 's|/|-|g; s|_|-|g')/memory/
Show full content of each memory file. These are crucial for understanding what the project is about.

**C4. Project stack**
Run:
```bash
cat PROJECT_CWD_PLACEHOLDER/package.json 2>/dev/null | python3 -c "
import json,sys
p=json.load(sys.stdin)
print('name:', p.get('name'))
print('version:', p.get('version'))
print('scripts:', json.dumps(p.get('scripts',{}), indent=2))
deps={**p.get('dependencies',{}),**p.get('devDependencies',{})}
print('all deps:', json.dumps(sorted(deps.keys()), indent=2))
"
ls PROJECT_CWD_PLACEHOLDER/.github/workflows/ 2>/dev/null
cat PROJECT_CWD_PLACEHOLDER/railway.toml 2>/dev/null
ls PROJECT_CWD_PLACEHOLDER/prisma/ PROJECT_CWD_PLACEHOLDER/migrations/ 2>/dev/null
find PROJECT_CWD_PLACEHOLDER -maxdepth 3 -name "*.test.*" -o -name "*.spec.*" 2>/dev/null | head -10
ls PROJECT_CWD_PLACEHOLDER/src/ 2>/dev/null | head -20
```

**C5. MCP configuration detail**
Show the full MCP server configurations from settings.json, settings.local.json, and .mcp.json. For each server: name, type, command/url, and any config options.

**C6. Hook configuration detail**
Show every hook currently configured: event type, matcher, command, and whether it's in global or project settings.

**C7. Current git state**
```bash
cd PROJECT_CWD_PLACEHOLDER && git branch --show-current 2>/dev/null
cd PROJECT_CWD_PLACEHOLDER && git log --oneline -10 2>/dev/null
cd PROJECT_CWD_PLACEHOLDER && git remote -v 2>/dev/null
```

Return EVERYTHING. Full file contents, not summaries. The caller needs the raw data.
```

---

## Step 3 — Synthesize all three agent results

After all three agents complete, you have:
- **A**: Complete feature inventory from official docs + changelog
- **B**: Deep usage profile from JSONL history
- **C**: Full config + project context

Now cross-reference everything and produce the report below.

---

## Step 4 — Produce the full report

The report must be comprehensive and verbose. Do not summarize. Do not cap at N items. Show everything relevant. Use clear markdown headers and tables where appropriate.

---

### SECTION 0: Your Claude Code Profile

A dashboard view. Show:
- Installed Claude Code version (run `claude --version`)
- Sessions analyzed, date range, total message count
- Most active branches
- Tool call breakdown (top 10 tools with counts)
- Average session depth, max session depth
- Error count and top error types
- Skills installed (global + project)
- MCP servers configured
- Hooks configured
- Custom agents defined

---

### SECTION 1: Feature Adoption Matrix

For EVERY major Claude Code capability, show adoption status. Organize by category. Use this table format:

```
| Feature | Status | Notes |
|---------|--------|-------|
| /compact | ✓ Used | Called 3× |
| /resume  | — Never used | Would save context on long sessions |
| /loop    | — Never used | Could automate your deploy checks |
```

Status options:
- **✓ Using** — confirmed in session history
- **⚙ Configured** — set up but zero usage
- **— Not set up** — not configured, not used
- **✗ Dead weight** — configured but never used, likely should remove
- **N/A** — doesn't apply to this project/stack

Cover ALL of these categories (from the feature inventory Agent A built):
- Built-in slash commands (every single one)
- Hook events (every event type)
- MCP capabilities
- Skill system features
- Agent/subagent features
- CLI modes and flags
- Settings options (meaningful ones)
- Status line
- Memory system features
- Keyboard shortcuts (notable ones)

For every "— Not set up" item where usage data or project structure suggests it would help: add a note explaining WHY it fits this project specifically.

---

### SECTION 2: Recent Launches — What Just Shipped

For every significant feature released in the last 60 days (from Agent A's changelog research):

Show each as:

```
#### {Feature Name} — {version} ({date})
{Exact quote from changelog}

**Applies to you**: Yes/No/Maybe — {1 sentence why, citing specific evidence from B or C}
**How to enable**: {exact command or config}
```

Do not skip any release. Do not filter. Show everything that shipped. Let the user decide what matters.

---

### SECTION 3: Dead Weight — Remove This

List everything that is configured but produces zero value:
- MCP servers with 0 calls in history
- Plugins/skills installed but never invoked
- Hooks firing on events they don't need to fire on
- Settings that do nothing for this stack

For each: what it is, the evidence it's unused, the command to remove it.

---

### SECTION 4: Workflow Automation Opportunities

From the repeated prompt analysis (Agent B, section B5), identify patterns the user repeats manually that Claude Code features could automate. For each:

```
#### Pattern: "{the repeated phrase or workflow}"
Seen: N times across sessions
Could be automated by: {specific Claude Code feature}
How: {exact implementation}
```

Look for: commit/push workflows, deploy triggers, branch questions, context re-establishment, test runs, repeated preambles that belong in CLAUDE.md.

---

### SECTION 5: Your CLAUDE.md Gaps

Based on the project structure (Agent C) and repeated prompts (Agent B), identify what belongs in CLAUDE.md that isn't there yet. Show:
- Current CLAUDE.md line count and whether it's approaching the effective limit (~200 lines)
- Repeated context that users provide verbally that should be documented
- Missing conventions (deploy workflow, component patterns, design system rules)
- Anything in memory files that should graduate to CLAUDE.md

---

### SECTION 6: Configuration Improvements

Specific changes to settings.json, hooks, or MCP setup that would reduce friction. For each:
- What to change and why
- The exact config snippet
- Expected benefit (cite the error/friction pattern from B6 it addresses)

---

### SECTION 7: Prioritized Action Items

Number every actionable recommendation from the entire report. Rank by expected impact. Format:

```
1. [10 min] **Remove swift-lsp plugin** — loads on every session, zero Swift files
   → claude plugin disable swift-lsp@claude-plugins-official
   → Evidence: 0 Swift files in project, 0 swift-lsp tool calls in 25 sessions

2. [5 min] **Add status line showing git branch** — you asked "which branch?" in 3 sessions
   → Add to ~/.claude/settings.json: "statusLine": {"command": "...", "refreshInterval": 10}
   → Evidence: B5 repeated prompt analysis, session data

...
```

No cap on the number of items. Include everything worth doing.

---

### SECTION 8: Things to Know About

Features that exist and are relevant but don't require immediate action — just awareness. Organized as a bulleted list of short "did you know" facts specific to this project/workflow. Include exact docs links or changelog quotes.

---

## Output rules

- **Be exhaustive**. A short report is a failure. This should take several minutes to read.
- **Never truncate a section**. If a table has 30 rows, show all 30.
- **No generic advice**. Every item must cite something specific from this project, this config, or this usage history.
- **Quote your sources**. Every feature cite gets a verbatim quote from the fetched content.
- **Show the data**. Where you drew conclusions from usage counts or error patterns, show the numbers.
- **End with**: "Reply with the numbers of items you want me to execute now." Then execute whatever they choose.
You can trim it, extend it, or fork it for your team.
What I think this means
I want to go back to the “calm down” camp for a second, because I owe them a fair hearing.
They are right that you don’t need to use every Claude Code feature. They are right that the thing you were using last month still works.
What I think they are missing is that the ceiling moved. There was a version of this tool where you could be a good user without trying too hard, and that version is gone. The new version requires either a full-time commitment to tracking the changelog, which few people have, or a system that tracks the changelog for you. I do not see a third option, there’s just too much being release each day.
I can live with that, I think.
We built the oracle. The oracle is now improving faster than we can absorb its improvements. The realistic path for a working developer who wants to stay close to the frontier is to use the oracle to keep up with the oracle. It is recursive and a little absurd, but it is also the honest answer to the situation we are actually in.
If this was useful, subscribe. Thank you.
I was just thinking about something to keep up to date with update... This is next level!!!